In 2007 when I taught in Belmont (one of the wealthier suburbs of Boston), I observed that a significant number of my students expressed stress about their time commitments. I devised a survey that asked students the following:
| Hours Per Week | Activity |
| 33 | School (7:55–2:30 Monday–Friday) |
| Homework (usually 1–2 hr/wk for each “regular” academic class; 4–6 hr/wk for each AP class) |
|
| Extra-curricular activities at school (sports, clubs, drama, band/orchestra, etc.). | |
| Activities outside of school (sports, church, youth groups, music lessons etc.; include both in-school and outside-of-school activities). | |
| part-time job and/or child care/family responsibilities (in a typical week) | |
| Total Scheduled Hours per week |
I also asked students to indicate whether their schedules caused them stress “rarely”, “sometimes” or “often.”
I found the following distribution for the number of hours per week for which my Belmont students were committed and their resulting stress levels:
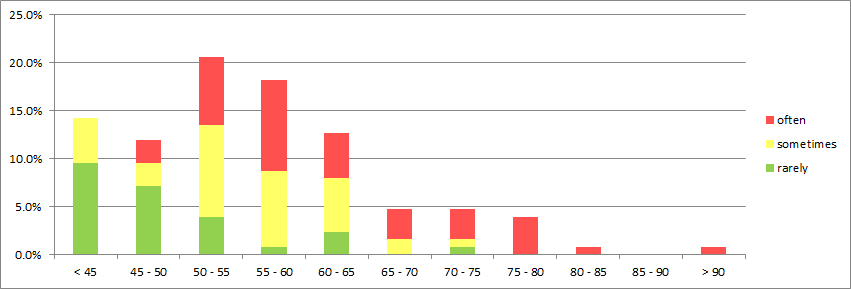
I talked with my students about how 40 hours a week was the equivalent of a full-time job, and the fact that the average student was committed for 55 hours per week explained why so many of them were feeling stressed.
Since 2011, I’ve been teaching in Lynn, a low-income city about 10 miles north of Boston. Lynn kids don’t talk nearly as much about the stresses in their lives, whether from their schedules or other sources, so I naïvely thought that they must therefore be less busy. This year, I surveyed my Lynn kids about their time commitments and I found out just how wrong that assumption was:
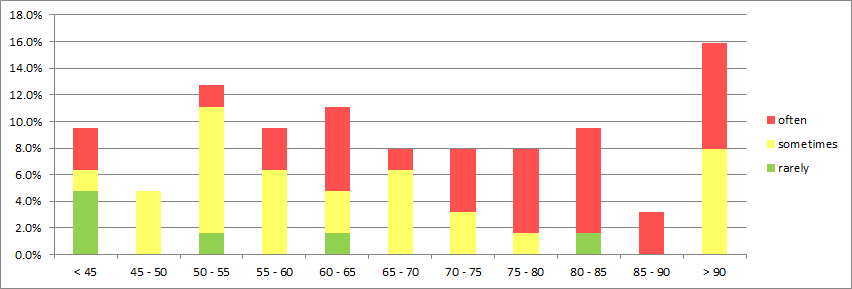
The average time commitment for my students this year is 68 hours per week.
The students were similar academically within their respective schools. The Belmont students represented a little over 10% of the student body, spanning grades 10-12. Students surveyed were from two AP Chemistry classes and two honors Chemistry 1 classes. (In Belmont, approximately half of the students take honors chemistry.) The Lynn English students represented just under 5% of the student body, spanning grades 11-12. Students surveyed were from three AP Physics classes and two standard level Physics 1 classes. (In Lynn, because of the math requirement, nearly all of the Physics 1 students are in the top 50% of their class.)
The differences between the two graphs are striking. The next time someone tells me something about poor people being lazy or less hard-working, I can cite evidence from my own classroom to the contrary.